Cisco recently announced software availability of NX-OS 9.2(2) with support for SAN Analytics on the Cisco MDS 9700 Series switches with 64G Modules. This software release begins the next phase in the architecture evolution of SAN Analytics.
In this blog, we will do a high-level comparison of SAN Analytics Architecture between the Cisco MDS 32G and 64G platforms and look at some of the new innovations of Cisco MDS 64G SAN Analytics.
But first, let’s cover methodologies used for performance monitoring. Utilization, Saturation, and Errors (USE) is a generic methodology for effective performance monitoring of any system. The USE metrics identify performance bottlenecks of a system. In the context of a storage system, we can add Latency as an additional element into the USE methodology to create LUSE. Full visibility into LUSE metrics of storage infrastructure is critical for performance monitoring and troubleshooting.
SAN Analytics and SAN Insights are advanced features of the Cisco MDS 32G switches since NX-OS 8.3(2):
- SAN Analytics is an advanced feature of Cisco MDS switches that collects storage I/O metrics from switches independent of host and storage systems. Over 70 metrics are collected per-port, per-flow (ITL/ITN), and streamed out. These metrics can be classified into one of the ‘LUSE’ categories.
- SAN Insights is a capability of Cisco Nexus Dashboard Fabric Controller (Formerly DCNM) SAN that receives the metrics stream from SAN Analytics. It provides the visualization and analysis of fabric-wide I/O metrics using the ‘LUSE’ framework.
Cisco MDS 32G SAN Analytics
Access Control Lists (ACL) enforce access control on every frame switched by the ASIC. The ACLs are matched by extracting certain fields from the frame header and on a match, the action corresponding to the entry is taken. On an F-port, FC Hard Zoning entries are programmed as ACLs in the ingress direction based on Zoning configuration to match on the frame SID and DID with action to “forward” the frame to the destination.
On Cisco MDS 32G switches, the I/O metrics are computed by capturing FC frame headers in the data path using an ACL-based ‘Tap’ programmed in the ASIC on ingress and egress direction of the analytics enabled ports. These Tap ACLs match on frames of interest for Analytics viz. CMD_IU, 1st DATA_IU, XRDY_IU, RSP_IU, and ABTS. A copy of the frame matching the Tap ACL is forwarded to an onboard NPU connected to the 32G ASIC.
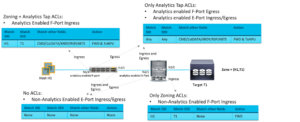
When SAN analytics is enabled on a port, the ACLs are programmed depending on the port type and direction as shown in Figure 1 below:
- F_Port Ingress: Analytics Tap ACLs + Zoning ACLs
- F_Port Egress, E_Port Ingress, E_Port Egress: Analytics Tap ACLs only
The Cisco MDS 32G NPU software Analytics Engine can be modified to accommodate custom metrics (Eg: NVMe Flush command metrics) or futuristic storage command sets (Eg: NVMe-KV) with the required ACL Taps in place.
Cisco MDS 64G SAN Analytics
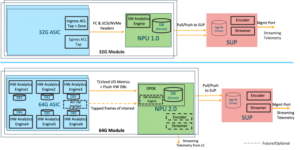
The Analytics Engine moves into the ASIC on Cisco MDS 64G switches, giving it a hardware acceleration. The Cisco MDS 64G Module has two 64G ASICs and each ASIC has six hardware Analytics Engines (one for every four ports). These Analytic Engines can compute I/O metrics at line rate on all ports simultaneously with the capacity to analyze upwards of 1 billion IOPS per Module. The hardware Analytics Engines have built-in Taps and do not need the ACL-based Taps to be programmed.
The metrics computed by hardware Analytics Engines are stored in a database inside the ASIC and periodically flushed to the NPU. The NPU runs a lightweight software process on top of DPDK (an open-source highly efficient and fast packet processing framework) that collects and accumulates the metrics pushed periodically from the hardware Analytics Engine. Even though the NPU does not run an Analytics Engine, it maintains the persistent metrics database per flow and remains the critical element of the solution. The shipping of metrics from the NPU database to the Supervisor is identical to the Cisco MDS 32G Architecture. The Cisco MDS 64G hardware Analytics Engine does not preclude an NPU software Analytics Engine to be enabled in a future software release for flexibility and programmability benefits.
A comparison of the Cisco MDS 32G and MDS 64G architectures are shown in Figure 2 below:
The Cisco MDS 64G hardware Analytics Engine computes some additional metrics for deeper I/O visibility:
- Multi-sequence writes I/Os are large writes involving multiple XRDY sequences. The written exchange completion time for these writes includes delays introduced by the Host (Rx XRDYn to Tx first DATAn+1) and the Storage (Rx Last DATAn-1 to Tx XRDYn). These metrics provide better analysis and accurate pinpointing of large write performance issues. The Analytics Engine separately tracks:
- Avg/Min/Max host write delay
- Avg/Min/Max storage write delay
- The total busy time metric tracks the total time there was at least one outstanding I/O per flow. This metric helps to characterize the ‘busyness’ of a flow relative to other flows.
The hardware Analytics Engine by default tracks SCSI and NVMe I/O metrics at ITL/ITN granularity. However, it can also be programmed to track metrics for various flow granularity of IT, ITL-VMID, ITN-NVMeConnectionID, or ITN-NVMeConnectionID-VMID. This gives flexibility in choosing the granularity of metrics and I/O visibility.
The 1GbE analytics port on the Cisco MDS 64G Module can stream the per-flow metrics directly (without the involvement of the Supervisor) in an ASIC native or standard gPB/gRPC format. This can serve future use-cases that require visibility into micro telemetry events, which would require high-frequency telemetry streaming.
Summary
The Cisco MDS SAN Analytics and SAN Insights is a key solution to monitor and troubleshoot performance problems in the MDS FC SAN using a ‘LUSE’ or any equivalent methodology. The Cisco MDS 64G platforms (operating at any speed) now come with a hardware Analytics Engine that can compute I/O metrics at line rate on all ports. The Cisco MDS architecture is the industry’s most flexible, programmable, scalable, and future-proof SAN solutions with no forklift upgrade of chassis or rips and replaces to adopt the latest SAN innovations.
To learn more, visit Cisco SAN Analytics and SAN Telemetry Streaming Solution Overview
Source: blogs.cisco.com Credit@ Harsha Bharadwaj